Spectroscopy
Topic outline
-

Helpful Pre-requisites:
1. Electromagnetic Waves - A Sea of Information
2. Blackbody Radiation and What the Stars Tell Us
Spectroscopy
Written by: Kathy Gustavson July 2016
Grade (Age) level: High School (ages 14-18), UniversityTopic areas: Continuous, Emission, and Absorption spectra. Atomic and molecular behavior causing these spectra.
The spectrum of an object is a graph of the intensity of radiation vs wavelength (or frequency). Spectroscopy is the systematic study of spectra and spectral lines. Studying spectral lines in astronomy provides evidence about the chemical composition and movement of distant objects.
A blackbody will give a continuous spectrum. But what causes the lines in other types of spectra? How do these lines provide information about these distant objects?-
Forum
-
Quiz
Try these five questions
-
-
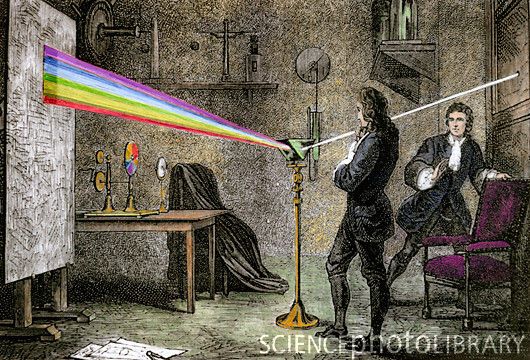 A rainbow could be produced by passing sunlight through a prism. The common theory at the time was that the prism itself added the color. During the 1600's, Isaac Newton took the colors made by a prism and passed it through a second prism, recombining the light back to white. This showed that white light itself was made up of all the colors.
The rainbow of colors produced by passing sunlight through a prism is a continuous spectrum. Scientist found they could make a similar spectrum in the laboratory by heating solid matter and passing the light produced through a prism. These were continuous spectra became the subject of study as scientists explored blackbody radiation.
Image credit: NASA
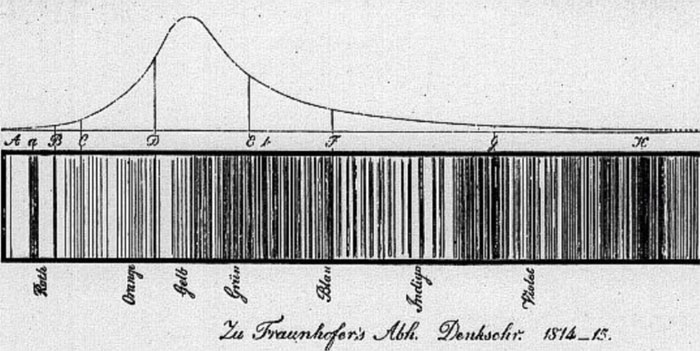
In 1814, Joseph von Fraunhofer looked at the light passed through a prism from the sun in a new manner. He was a German master optician who used his skills to actually magnify the spectrum the sun produced. He was surprised to find over 600 dark lines crossing this rainbow of light made by the sun. Today we know of 30,000 "Fraunhofer" lines!
About 50 years later, chemists also produced dark lines in spectra in the laboratory. Flame tests of different metals were a well known phenomena. (image -Wikipedia)
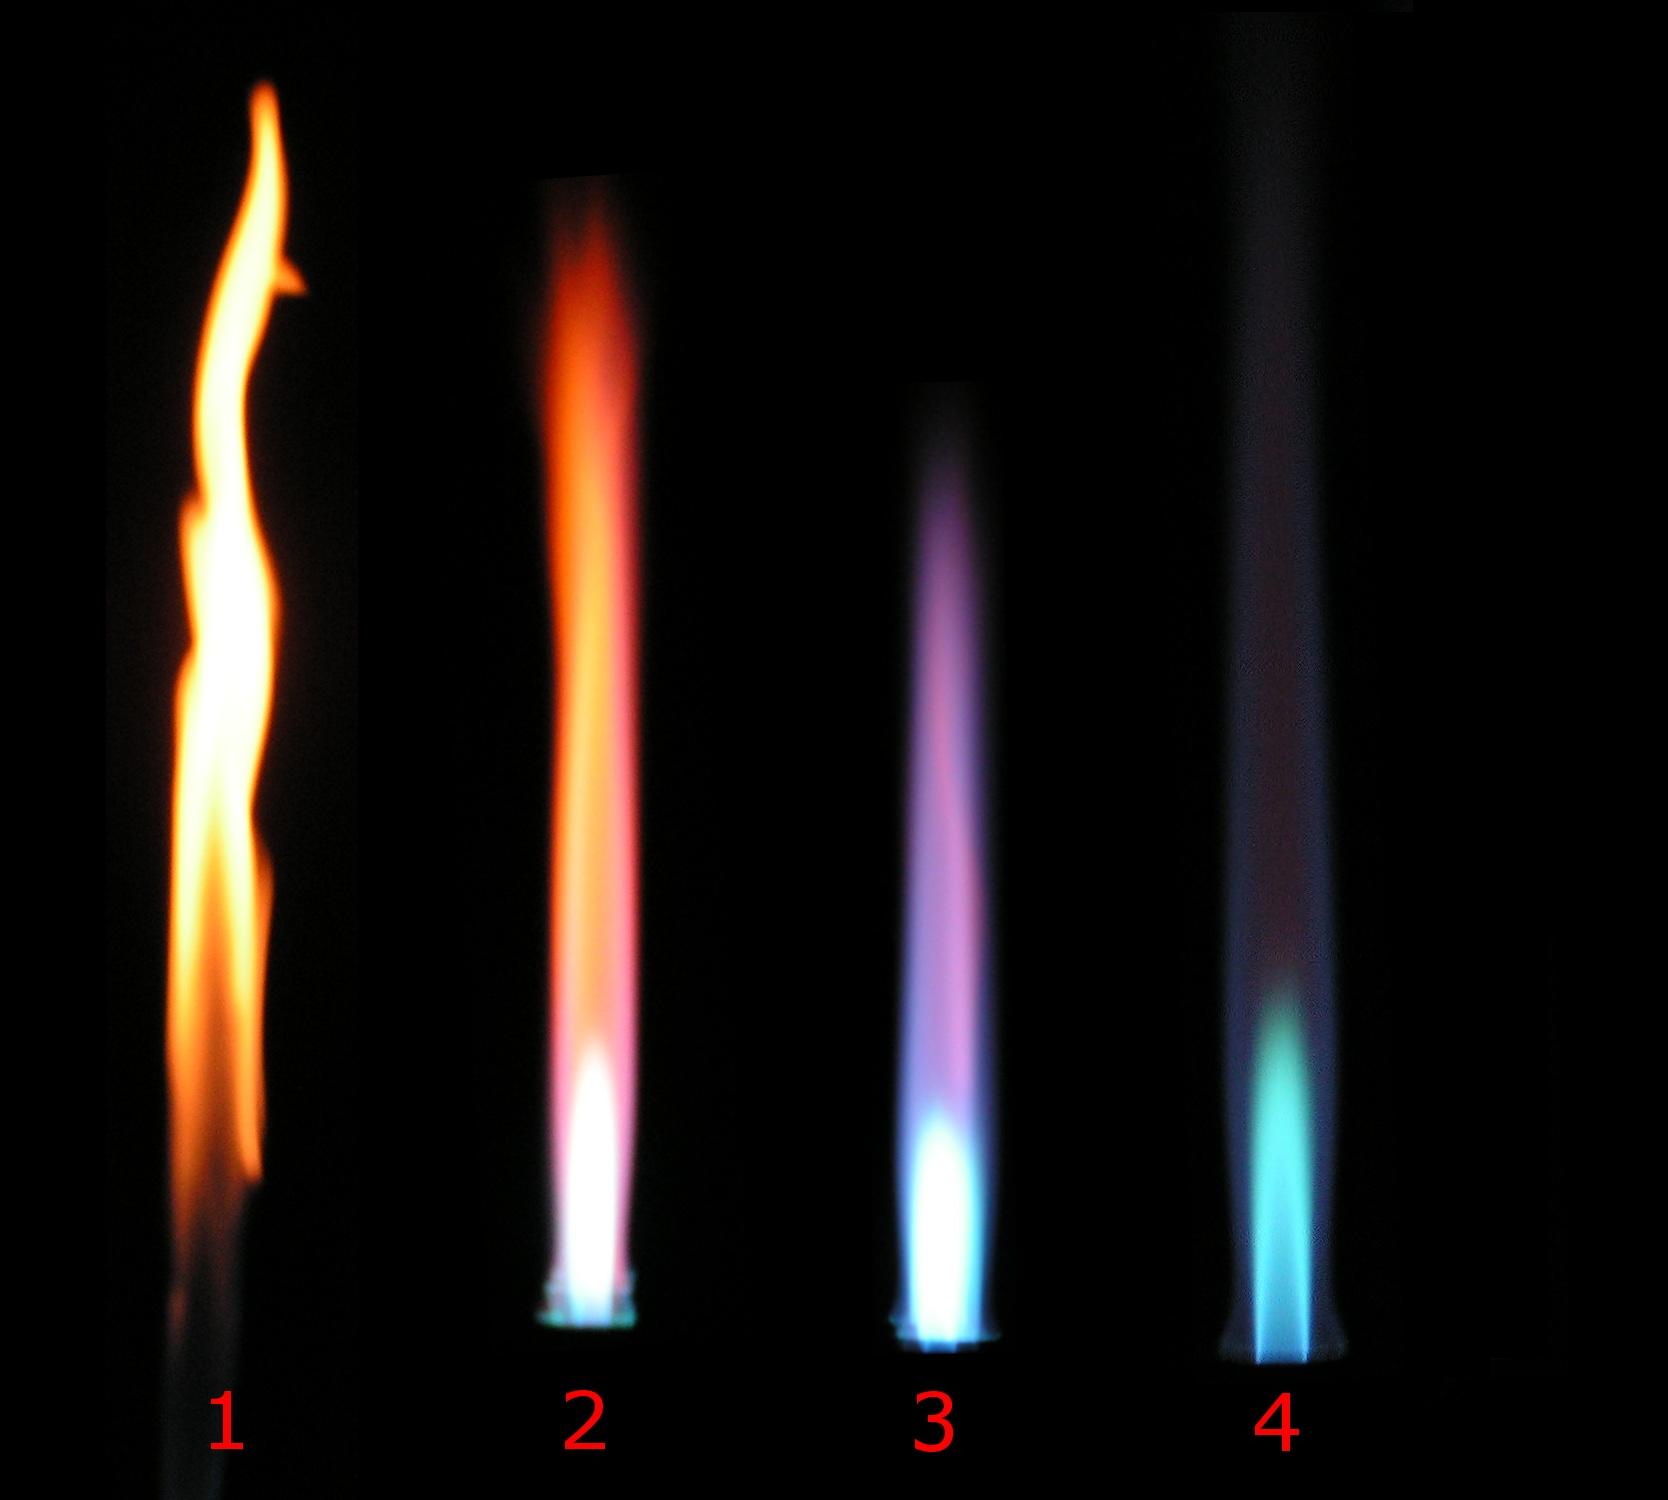 Robert Bunsen (Bunsen burner fame) invented a new gas burner which produced a clean flame - no color of its own. Gustav Kirchhoff teamed up with Bunsen and suggested sending the colors produced in a flame test through a prism. They discovered spectral lines - bright, thin lines of color on a dark background. Thus the science of spectroscopy was born.
By 1859, Bunsen and Kirchhoff identified all the known element's spectra. They then discovered a couple of new ones - Cesium and Rubidium. The 1868 solar eclipse brought the discovery of the element Helium in the sun's spectrum.Next - a look at Gustav Kirchhoff's laws and the different types of spectra.
-
 There seemed to be three main types of spectra: continuous, emission, and absorption.
Kichhoff's experimentation showed a connection between absorption and emission spectra.
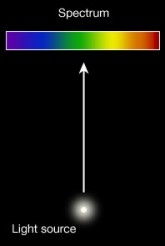
He summarized his findings in three laws:Law 1: Hot opaque body or hot dense gas produces a continuous spectrum:
This was seen with flame tests of solid objects and with stars (of which the composition was unsure at the time)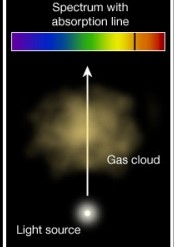 Law 2: A cool transparent gas in front of a hotter source of a continuous spectrum creates a dark line or absorption spectrum.
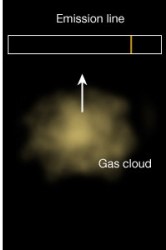 Law 3: A hot, low density transparent gas against a cooler background emits a bright line spectrum.
All images creative commons Penn state.
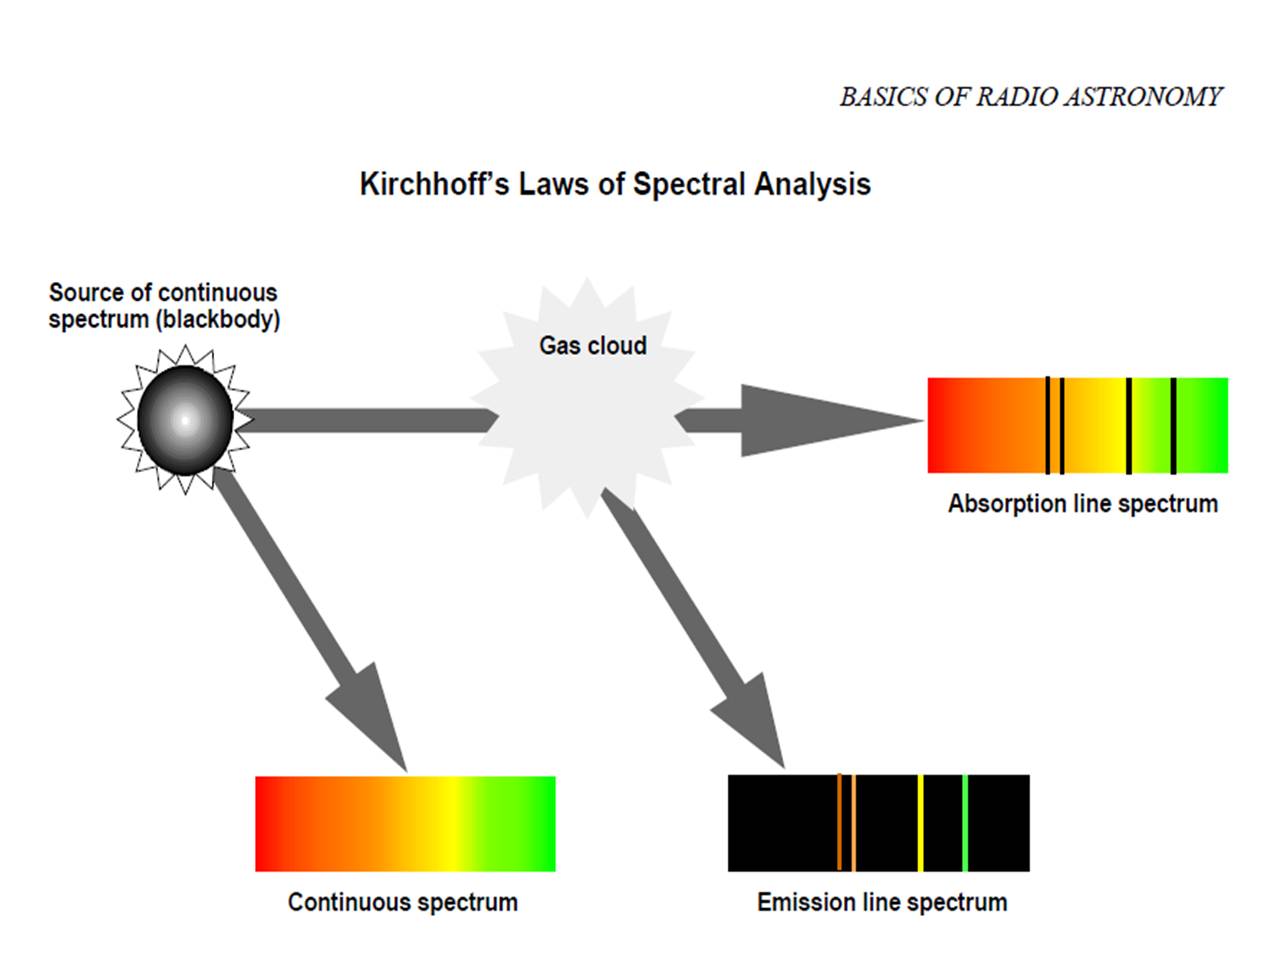 Another illustration of Kirchhoff's Laws:
Answer the following questions in Journal 2: Kirchhoff's Laws
a.) What is the difference between an emission spectrum and a continuous spectrum?
b.) What is the difference between an absorption spectrum and an emission spectrum?
c.) What has to be in place between the source of the light and your eye in order to see the different spectra?
d.) Spectroscopy today uses a graph to quantitatively study the light producing the spectra.
- What would you expect to see as an absorption line?
- What would you expect to see as an emission line?-
Journal
-
-
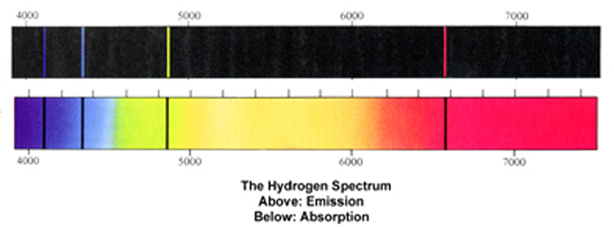
Since the hydrogen atom shows a simple visible-light spectrum, it was readily studied. Shown below, is the emission, and then corresponding absorption spectra of hydrogen at visible wavelengths: (image credit: Honoluluuniversity.edu)
In 1885, Jakob Balmer, a Swiss schoolteacher, described the regularity mathematically. By trial and error, he came up with:
\( 1/ \lambda = R (1/4 - 1/n2 ) \)
where λ = wavelength
R = Rydberg constant = 1.097 x 10⁷/m
n = any whole number integer greater than 2.In honor of his work, the visible wavelengths of the spectral lines of hydrogen are called Balmer lines, and the pattern, including the invisible wavelengths of hydrogen in the ultraviolet range, is called the Balmer series.
The next question asked was "Why does it work?" This was the question Niels Bohr asked. He wanted to derive this same equation using physics.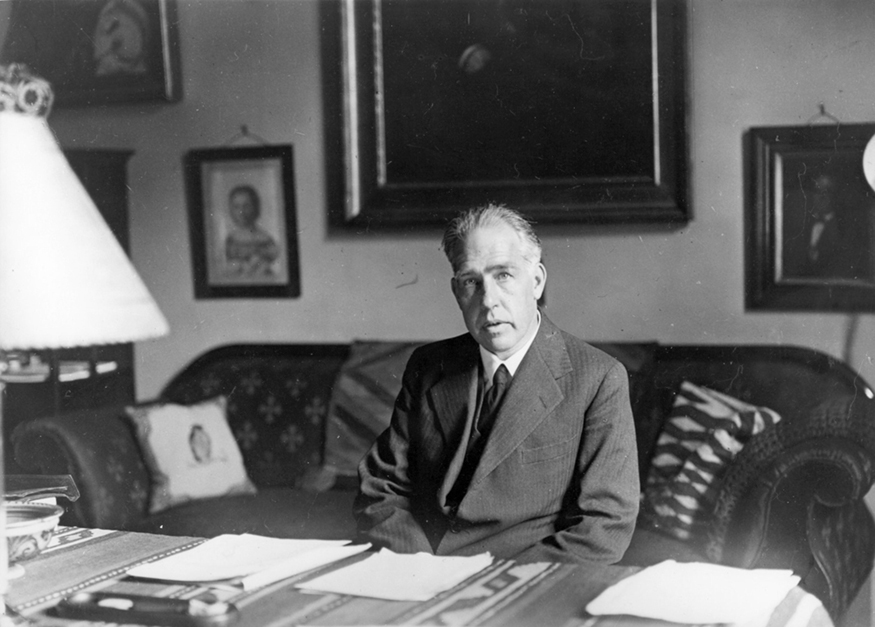
Niels Bohr, Danish physicist, used the planetary model of the atom to explain the atomic spectrum and size of the hydrogen atom. His many contributions to the development of atomic physics and quantum mechanics, his personal influence on many students and colleagues, and his personal integrity, especially in the face of Nazi oppression, earned him a prominent place in history. (credit: Unknown Author, via Wikimedia Commons)
What was needed was to understand the structure of an atom:
Go to the bottom of this section, click on the video: "The History of the Atom" and do Journal 3a: History of the Atom Video Questions.
Then return here to read about Niels Bohr:Neils Bohr joined Rutherford (the discoverer of the nucleus), where they sought to understand the structure of hydrogen, and how Balmer's formula actually worked. The answer he came up with fit with Max Planck's and Albert Einstein's ideas of quantized energy: Bohr proposed specific orbits for electrons, that is, electrons can only gain or lose a specific amount of energy.
This idea is reviewed in the next section, which is from openstax CNS (go to: https://cnx.org/about to find out more about openstax textbooks)
"Download for free at http://cnx.org/contents/9a2ad24a-bdd0-4aa8-a99c-36ba54ec0f1f@6."
Answer these questions about the reading below in Journal 3b: Mysteries of Atomic Spectra
a.) What do electron orbits have to do with quantized energy?
b.) How was the original formula derived?
c.) Are all the wavelengths in the visible part of the spectrum?*************************************************
The great Danish physicist Niels Bohr (1885–1962) made immediate use of Rutherford’s planetary model of the atom. Bohr became convinced of its validity and spent part of 1912 at Rutherford’s laboratory. In 1913, after returning to Copenhagen, he began publishing his theory of the simplest atom, hydrogen, based on the planetary model of the atom. For decades, many questions had been asked about atomic characteristics. From their sizes to their spectra, much was known about atoms, but little had been explained in terms of the laws of physics. Bohr’s theory explained the atomic spectrum of hydrogen and established new and broadly applicable principles in quantum mechanics.
Mysteries of Atomic Spectra
As noted in Quantization of Energy , the energies of some small systems are quantized. Atomic and molecular emission and absorption spectra have been known for over a century to be discrete (or quantized). Maxwell and others had realized that there must be a connection between the spectrum of an atom and its structure, something like the resonant frequencies of musical instruments. But, in spite of years of efforts by many great minds, no one had a workable theory. (It was a running joke that any theory of atomic and molecular spectra could be destroyed by throwing a book of data at it, so complex were the spectra.) Following Einstein’s proposal of photons with quantized energies directly proportional to their wavelengths, it became even more evident that electrons in atoms can exist only in discrete orbits.

Part (a) shows, from left to right, a discharge tube, slit, and diffraction grating producing a line spectrum. Part (b) shows the emission line spectrum for iron. The discrete lines imply quantized energy states for the atoms that produce them. The line spectrum for each element is unique, providing a powerful and much used analytical tool, and many line spectra were well known for many years before they could be explained with physics. (credit for (b): Yttrium91, Wikimedia commons)
In some cases, it had been possible to devise formulas that described the emission spectra. As you might expect, the simplest atom—hydrogen, with its single electron—has a relatively simple spectrum. The hydrogen spectrum had been observed in the infrared (IR), visible, and ultraviolet (UV), and several series of spectral lines had been observed. (See figure below). These series are named after early researchers who studied them in particular depth. (Jakob Balmer was one of these!)The observed hydrogen-spectrum wavelengths can be calculated using the following formula:
where λ = wavelengthThe constant nf is a positive integer associated with a specific series. For the Lyman series, nf = 1; for the Balmer series, nf = 2; for the Paschen series, nf = 3; and so on. The Lyman series is entirely in the UV, while part of the Balmer series is visible with the remainder UV. The Paschen series and all the rest are entirely IR. There are apparently an unlimited number of series, although they lie progressively farther into the infrared and become difficult to observe as nf increases. The constant ni is a positive integer, but it must be greater than nf . Thus, for the Balmer series, nf = 2 and ni = 3, 4, 5, 6, . . . Note that ni can approach infinity. While the formula in the wavelengths equation was just a recipe designed to fit data and was not based on physical principles, it did imply a deeper meaning. Balmer first devised the formula for his series alone, and it was later found to describe all the other series by using different values of nf. Bohr was the first to comprehend the deeper meaning. Again, we see the interplay between experiment and theory in physics. Experimentally, the spectra were well established, an equation was found to fit the experimental data, but the theoretical foundation was missing, until Bohr made his proposal.
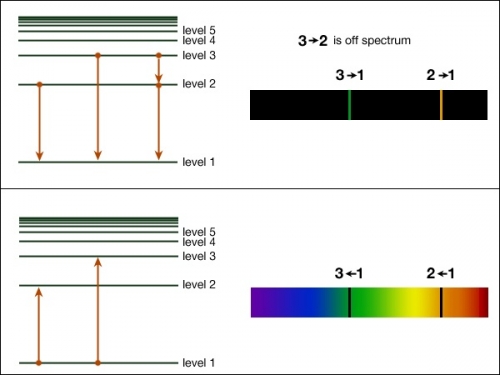
Below is a schematic of the hydrogen spectrum shows several series named for those who contributed most to their determination. Part of the Balmer series is in the visible spectrum, while the Lyman series is entirely in the UV, and Paschen series and others are in the IR. Values of nf and ni are shown for some of the lines.

**********************************************
The next section will take you through the idea of specific energy levels and how they relate to the spectra we see for atoms and molecules.-
Mr. Andersen of Bozeman Science describes the history of the atom.
Take notes and then answer the following questions in Journal 3a: History of the Atom Video Questions (the questions are also listed when you open the journal 3a).
a.) List the people discussed in order of their work (there are eight).
b.) Who discovered the electron?
c.) Who discovered the nucleus?
d.) Who discovered the neutron?
e.) Which particle is thought to have a dual nature?
f.) Whose work provided evidence for this dual nature?
-
 If you have had chemistry already, these diagrams should look familiar to you. This section will consist of a website for some review and how it relates to astronomical observations.
(image from Penn state Astro 801)
Go to the URL below from Penn State Astro 801. Once at the website, you can review the first few paragraphs about Kirchhoff's Laws and Spectroscopy, or skip down to the paragraph that starts with "Returning to atomic physics and . . . " (its right after the box that says "Want to Learn More?").
You may try the PhET simulation if you have the current version of JAVA.As you are reading the URL from Penn State Astro 801, answer the following questions in Journal 4: Energy Levels (the questions will also be listed in the journal)
a.) Review: What is a photon?
What is the equation for the energy associated with each photon? (Recall Mac Planck . . .)
Note: This website uses the Greek letter ν (nu) for frequency f, and this Greek letter looks like the v used for velocity! Confusing . .
b.) What is the relationship between orbits and energy?
c.) What is another name for orbits?
d.) Is a jump down by an electron an emission or absorption of a photon? Explain.
e.) Is a jump up by an electron an emission or absorption of a photon? Explain.
f.) What is the equation to find the frequency of an emitted or absorbed photon?
g.) If a star's light is shining through a cloud of interstellar gas, what happens to some of the photons from the star? What does this look like to someone on earth?
h.) What type of spectrum do you get when the gas and dust in interstellar space is warm, that is, the atoms and molecules have electrons in higher energy levels?
i.) Consequences:
1. How can we tell what a gas cloud in space is composed of?
2. Why do we NOT see an emission spectrum from a cloud of gas when the electrons return to their ground levels?
3. What are the likely causes of a star's absorption spectrum?-
Journal
-
This image might help you synthesize what you have learned about photons being absorbed and emitted by electrons undergoing level changes:
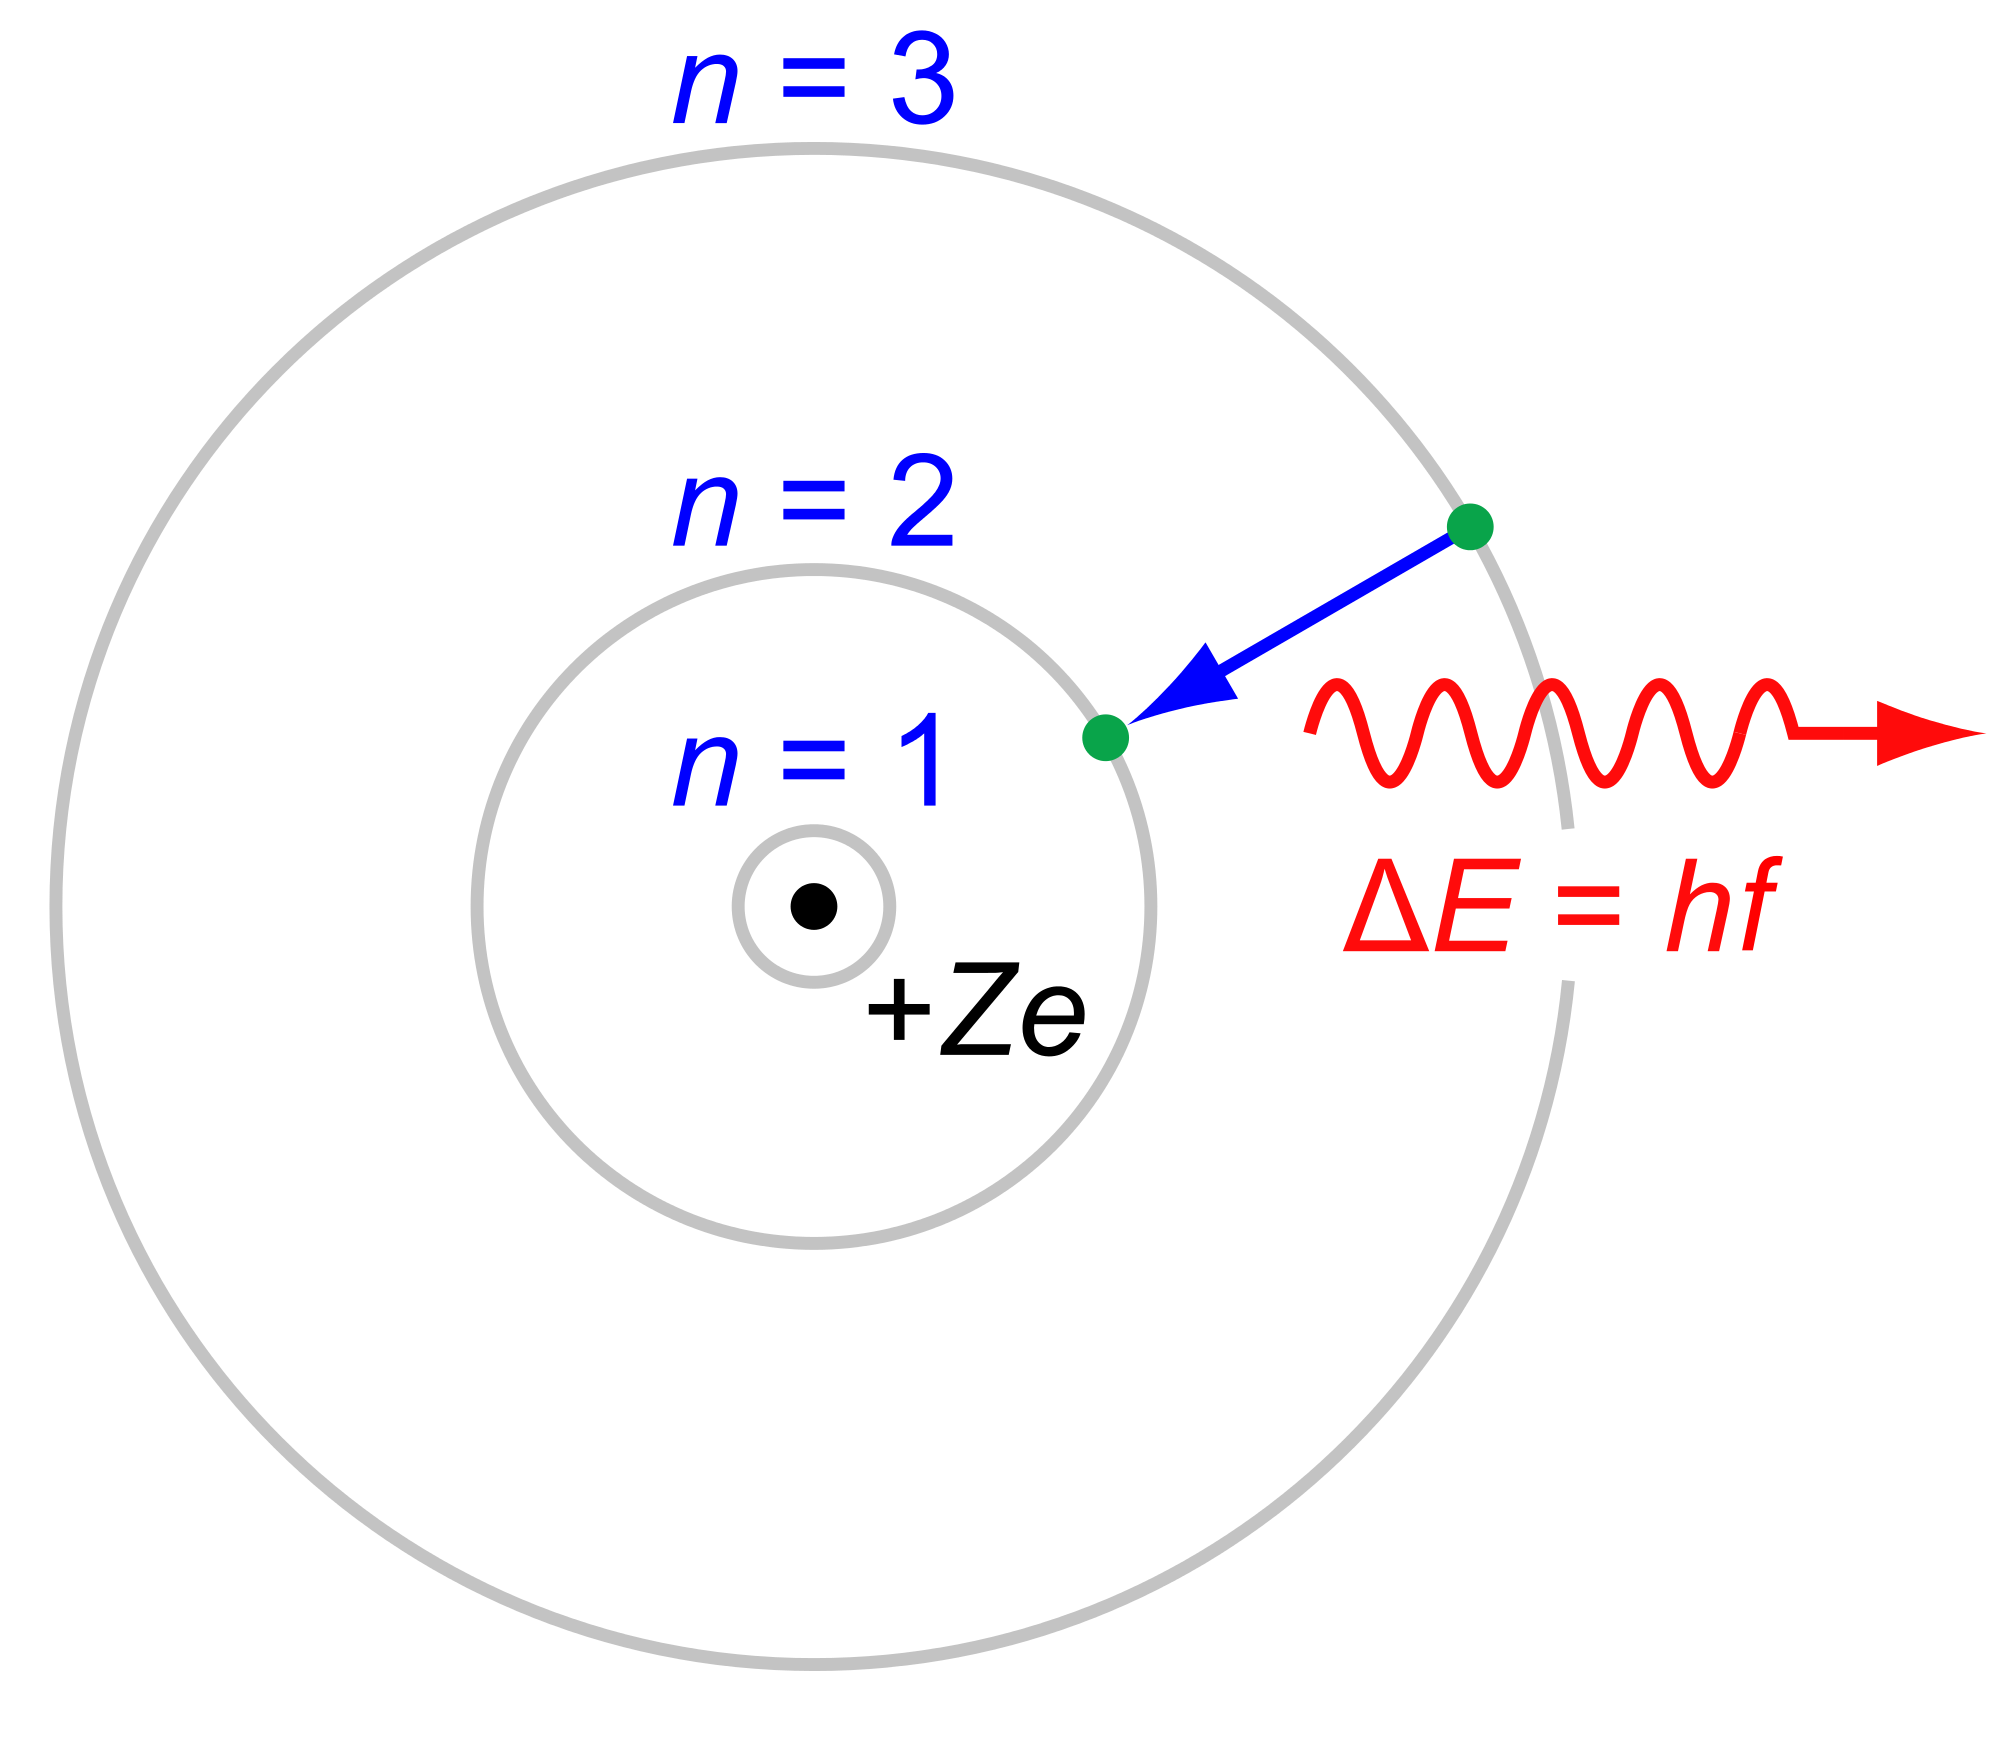 This electron emitted a photon when it jumped from level 3 to level 2. The photon is the first in Balmer series and corresponds to light with a wavelength of 656 nm (red). Recall that E=hf is Planck's equation (See project on Blackbody radiation), which can also be written in terms of wavelength:
ΔE = hc/λ, where c is the the speed of light, h is Planck's constant, and λ is the wavelength.
-
-
The information that comes to us from space is in the form of electromagnetic waves. Studying the spectra produced by these waves enables astronomers to learn many things about the universe. Spectra are analyzed as graphs. This project will introduce you to the analysis of spectra from space.
We will use the Sloan Digital Sky Survey to learn about Spectra from space:
The Sloan Digital Sky Survey (SDSS) is a project using data collected by the Sloan Telescope and its instruments to make a map of a large part of the universe. This data is shared with scientists throughout the world for their research. It is also made available for student use. The database provides photometric (images) and spectroscopic data of millions of astronomical objects. If you would like to work with the data, go to the Sloan Digital Sky Survey Projects listed under the High School and University Projects.Using the Tools of the Sloan Digital Sky Survey is a project which explains in detail how photometric (imaging) and spectroscopic data are captured, recorded and accessed in the SDSS database. Check that project out when you are done with this one!
To complete this section about the different astronomical spectrum graphs, click on the link below, SDSS Spectra. As you are reading through the material, it will refer to Pre-flight training and Launch activities. You may ignore these references since they will be addressed in other projects you may do later.
As you are the reading the information, define the following vocabulary in Journal 5: Spectra from Space
a.) spectrum graph
b.) X and Y axes
c.) continuum
d.) emission line
e.) absorption line
f.) blackbody curve
g.) bin
Also answer these questions:
h.) Which astronomical object is associated with a peak (not a spike)?
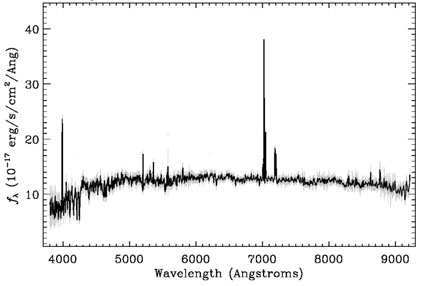
i.) Describe the spectrum graph of a galaxy.
j.) Define a quasar.
k.) Describe the spectrum graph of a quasar.
l.) What does an absorption line look like on a graph?
m.) What does an emission line look like on a graph?
n.) Were you correct in identifying the object responsible for each of the spectra in step 3?
Within the site, there is a link to another resource about spectroscopy from Arizona University. It is great review for this whole project. (You do not have to review the information about the Doppler Effect, there is a different project for that topic!)-
Journal
-
URL
This is a brief overview of the types of spectra astronomers analyze.
Thanks to Kate Meredith, education consultant for SDSS
-
-
Review Spectroscopy with the link in this section, "What is Spectroscopy?", from NASA and The Deep Impact Legacy Site.
Use Journal 6: Spectroscopy Proficiency Project to show your research on any type of spectrograph you choose.
A spectrograph is an apparatus for photographing and recording spectra. You could choose visible or invisible light spectra. The following is a list of items you should include in your report on your research:
1. Type of spectrograph, include image
2. Main scientific use
3. An example of a spectral analysis of an object (preferably astronomical) using that type of spectrograph. Include two or three of the wavelengths making up the spectrum.
4. When discussing the wavelengths: was they emitted or absorbed?
5. What part of the spectrum are these wavelengths in?
6. What situation would have caused the particular spectrum you see?
7. What does quantum theory have to do with the ability to see the spectrum? (It can be a brief answer!)
An alternate choice would be to photograph your own star spectra. Upload your pictures to Journal 6: Spectroscopy Proficiency Project, and discuss what you did and your results.
The video link from "Sky and Telescope" field tested systems will show you how to make these spectra:
-
Please let us know your thoughts about this course by using the discussion forum below
- What was your favorite activity?
- What was the most important part of the course for you?
- Are there any areas that need improvement?
- How was the length of the course?
- Any additional comments
After you use the discussion forum, please answer the BRIEF survey questions in the link below.
Thank You!!!
-
It is very brief.
Thank you!