How do We Know What the Solar System Looks Like?
Topic outline
-
-
Forum
-
-
To learn about the Solar System, it helps to understand coordinates that can be used to describe it.

You may have seen coordinates on an x-y graph - x goes horizontally and y goes vertically. The graph above is a very simple graph of x and y.
But to make a graph of the Solar System, we need to use a different type of coordinates. We are looking from Earth, and Earth is a sphere. So we must use coordinates that can work on the surface of a sphere. The coordinates for the sky are based on coordinates for the Earth.
-
Do you know how to describe your position on the Earth? One way would be to give your street address. For example:
1060 West Addison Street
Chicago, Illinois 60613
United States of AmericaBut, what if you were constantly on the move? Or, what if you were in the middle of the ocean? In that case, you couldn’t give a street address, but you could still identify your position using your coordinates on the surface of the earth, known as your longitude and latitude.
Latitude is measured in degrees north or south of the Equator. The Equator is an imaginary line at 0° latitude. The North Pole is at 90° North, and the South Pole is at 90° South.
The picture below shows a map of the Earth. The center of the map, just off the west coast of Africa, is the point where the Equator and the Prime Meridian meet.

Take any standard piece of paper (8.5 x 11 inches) and hold it in the "landscape" orientation. If the paper has a map printed on it, great! Form a cylinder by taping or holding the two short sides together. If this paper has a map of the earth on it, this cylinder is a simple model of the earth.
Answer the following questions below in Journal 0: Comparing Models of the Earth
1. Compare your simple model to another model of the Earth, a globe. How are the two models similar? How are they different?

2. The flat map is a two dimensional model and the globe is a three-dimensional model. Which model is better for modeling the the Earth? Why do you think that is so?
3. Are there any other models of the Earth you can think of? How are they different?
-
Is there anything wrong with your model of the Earth? Well, for one thing, the Earth is not a cylinder! The entire bottom edge of your model represents the South Pole, which is a single point on the real, spherical Earth.
Another problem with your model is that it doesn’t accurately represent true sizes. Antarctica appears to be the largest continent on the planet, but in reality it’s not much larger than the United States. The map below shows the true sizes of the United States and Antarctica:
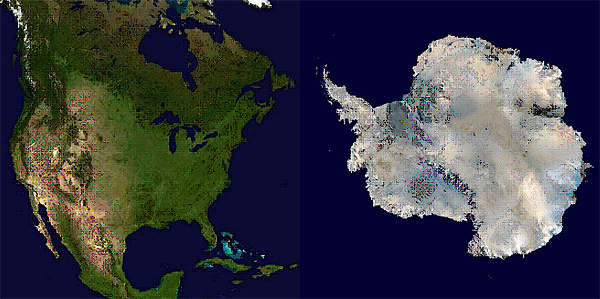
In fact, the closer something is to either the North or South Poles, the more horizontally-stretched it will appear on a simple map like the one from the previous topic.
These problems are the reason that we have globes! Globes are a perfect representation of the spherical Earth. However, globes have their own problems: they’re bulky, not everyone has one, and they’re not easy to graph on.
For these reasons, we still use flat maps. In spite of their problems, maps are useful representations of the features of the Earth.
-
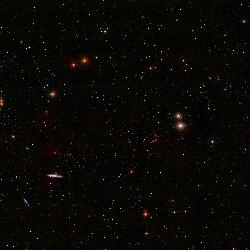
Have you ever looked up at the sky from a dark place? You see lots of stars, as shown in the picture at the right. You can almost imagine that the stars are painted on the inside of a gigantic black sphere.
In reality, this sphere doesn’t exist; stars are all at vast distances away from Earth and from one another. Even though it’s not real, the idea of the Celestial Sphere is useful, because it helps us point out specific places in the sky.
Image credit: Sloan Digital Sky Survey
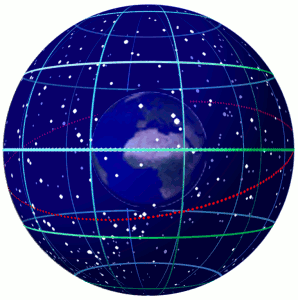 The celestial sphere gives astronomers a coordinate system for the sky, based on the system that we use here on Earth. The North Celestial Pole is directly above the Earth's North Pole, close to the North Star. There is also a Celestial Equator, which is directly above the Earth's Equator. Finally, just as we can imagine that lines of Longitude and Latitude are painted on the Earth, we can also picture coordinates painted on the inside of the imaginary Celestial Sphere.

Image credits: All spheres are Wikipedia Commons
Both the stars and the coordinate lines on the imaginary Celestial Sphere appear to rotate around the Earth, even though it’s really the Earth that's rotating. But because both the stars AND the celestial sphere seem to rotate, the same star will appear at the same place every night.So if you asked an astronomer where she was pointing her telescope to see a specific star, she would answer with the coordinates of that star on the Celestial Sphere.

The Celestial Sphere Woodrow Wilson Memorial with the Assembly Hall in the background. Palais des Nations, Geneva, 2010. From Wikipedia
-
The celestial coordinate that takes the place of longitude is called Right Ascension, but this is often shortened to RA. It can be measured in degrees or hours. We will use decimal degrees, since that is what the computer will use. (When hours, minutes and seconds are given, it must be converted to decimal degrees), Just as longitude on the Earth starts with 0º at the Prime Meridian, RA starts with 0º at a specific line on the celestial sphere.
The celestial coordinate that takes the place of latitude is called Declination, often abbreviated Dec. It is measured in degrees north or south of the Celestial Equator. The Celestial Equator is at 0º dec; the North Celestial Pole is at +90º, and the South Celestial Pole is at -90º.
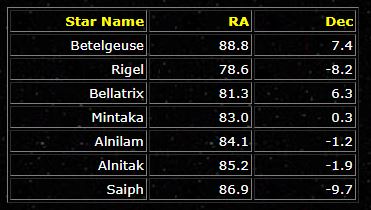
Together, the RA and Dec of a star make up an ordered pair that can be plotted on a graph. For example, the coordinates of seven well-known stars are given in the following table:
Using Journal 1: RA and Dec, answer the questions:
Practice 1. What are the ordered pairs of (RA, Dec) for these stars?
Question 3. As you may know from math, when you have a list of ordered pairs, you can make a graph. If you made a graph with RA on the x-axis and Dec on the y-axis, what do you think you would see?
Explore 2. Make a graph of the stars above. You can do this in one of two ways: either on a sheet of graph paper, or with a spreadsheet program. Whichever method you use, make sure you make a map with the right scale: RA from 0 to 360, Dec from -90 to 90, BUT, look at the numbers to adjust your scale to reflect your data. Also, make sure the graph is twice as long as it is wide.
To use a spreadsheet program, you can use the link below to download the data. First, use an excell spreadsheet, or a google sheet. If you use a google sheet, you can use something called "zoo tools". These are available free as an "add-on" from the Google Play store. Import the CSV file from your desktop to the spreadsheet. You can make a graph using the zoo tools under add-ons.
Download the data as a CSV (comma-separated value) file.
Question 4. What do you see in the graph? Do you recognize the shape of this group of stars? Is there anything about the way the stars appear that surprises you?If you did this for all of the bright stars in the sky, you’d have a map of all the constellations. We won't be using maps and coordinates to study stars, though. We'll be studying objects in the Solar System, all of which are much closer to us.
Go on to Lesson 2, where you will see how you can use RA and Dec to map the Solar System.
-
Journal
-
-
In the last activity above, part d, you learned about what coordinates are used to describe the positions of things in the sky. Now you are ready to use those coordinates to make a map of the Solar System, as we see it from Earth. But it's harder to make maps of the Solar System than it is to make maps of stars, as you'll see in the sections below.

image credit: SDSS
-
Let's start with the planets. If you've spent many nights looking at the sky, you might have noticed two things about the planets. The first thing is that planets are some of the brightest things in the sky - Venus is very bright, white, and usually low in the sky, Mars is bright and red, and so on. It's important to remember that we didn't just make up our model of the Solar System - it's based on things that we actually see in the sky.
The other thing you might have noticed about the planets is that they move! Stars seem to move across the sky as the Earth rotates, but they don't change positions relative to each other. But the planets move, night after night, against the background of stars.
Planets don't really move around the Earth - they move around the Sun. But we clearly see them move, night after night, when we look at the sky.We know enough about how the planets move that we can calculate exactly where a planet will be each night. On a single night, we can assign coordinates (RA and Dec) to each planet, even though we know that the coordinates will be a little different the next night. Let's look at where the planets were on the night of September 23rd, 2017
Jupiter image from the National Space Science Data Center. (link opens in new window)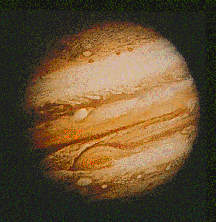
-
The table below shows the coordinates of the planets on September 22nd, 2006 (The "Heavens Above" site gives the addresses. These were then converted to decimal degrees). Uranus and Neptune are listed, even though you can't see them without binoculars or a telescope:
Question 1: Below, in Journal 2: The planets, please graph the above with RA on the vertical axis, and Dec on the horizontal. Make appropriate scales. If possible, use the google tools you used previously. Copy the graph into the journal.Planet RA Dec Mercury 194 -6.0 Venus 171 5.5 Mars 188 -2.9 Jupiter 225 -16.1 Saturn 143 15.6 Uranus 344 -7.8 Neptune 320 -15.
Question 2: Look carefully at your graph. You have made a map of the Solar System as it appeared from Earth on September 23rd, 2017! What does this map tell you about the Solar System? Answer below in Journal 2: The Planets.-
Journal
-
-
You might have noticed in the last activity that it was hard to learn anything about the Solar System. There were only seven points on the graph! Imagine if you had a map of the Earth, but you could only see seven cities.
You will need more points to learn more about the shape of the Solar System. There are only a few planets, but there are many other objects in the Solar System. There are more than 300,000 known asteroids, small rocky objects that orbit the Sun. They range in size from hundreds of kilometers across to just a few meters. They may be small, but there are a lot of them! Let’s see if they can help us get a better picture of the Solar System.
Even though asteroids are smaller than planets, they have well-known orbits around the Sun, just like planets do. This means that looking at the orbits of asteroids can help us learn more about the shape of the Solar System.
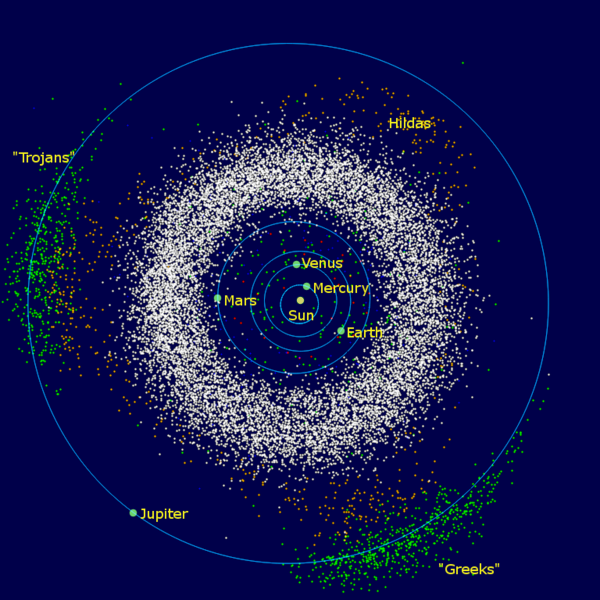
By Mdf at English Wikipedia - Transferred from en.wikipedia to Commons., Public Domain, https://commons.wikimedia.org/w/index.php?curid=1951518
The asteroids of the inner Solar System and Jupiter: The donut-shaped asteroid belt is located between the orbits of Jupiter and Mars. Sun Jupiter trojans Orbits of planets Asteroid belt Hilda asteroids (Hildas) Near-Earth objects (selection)
-
SkyServer includes a database that contains information about hundreds of thousands of asteroids. The database comes from the Minor Planet Center at Harvard University, which collects information about newly discovered asteroids.
SkyServer includes various tools for searching this database. One of the tools is called the Solar System Search Form. It gives you a list of the positions of all the asteroids on September 22nd, 2006. You can combine this with the graph of planets that you made in the last Explore activity to see how the Solar System looks from Earth. But now, instead of seven points, your map can have thousands of points!
Use Journal 3: Using Skyserver to search for minor planets
Explore 2. Click the link below to open the Solar System Search Form. It will open in a new window.
You have two choices on the form, shown in two drop-down menus. You can select the number of asteroids to return data for [10, 50, 100, 500, 1000, 5000, 10000, or 30000], and you can select two different ways of returning the data. Stick with "RA and Dec" for now.
After you have made your choices, click Generate Query. You will see computer code written in the box below. The code is written in a language called SQL, which is a language often used to search databases. You can choose HTML or CSV as output options. HTML will display the results in your web browser. CSV will display results in a format that you can download and open in a spreadsheet program.
Choose several different values for the number of asteroids, and see the results as HTML. Then, choose the same numbers of asteroids, but choose CSV. Download the data to your computer. If your computer asks you whether to Open or Save the file, choose Save.
Question 2. When you make changes to the choices in the drop-down menus, what changes do you notice in the SQL code?
Question 3. What do you see when you have the form return asteroids as HTML? As CSV? What do you expect to see when you make a graph in the next activity?
-
You now have data for a number of different asteroids. On this page, you will make graphs of your data. These graphs will be maps of the Solar System.
Explore 3. Make graphs of the positions of asteroids on September 22nd, 2006. Make graphs of different numbers of asteroids - 10, 500, 1000, and so on.
Use a spreadsheet program to make the graphs. Here are instructions about how to make the graphs in Excel (link opens in new window).
If you don't have Microsoft Excel, try using google sheets. Then use the free add-ons called zooniverse tools as in previous sections.
Put RA on the x-axis and Dec on the y-axis. Again, make sure your graph is twice as long as it is wide. The shape and axes of the graph should look like this:

Use Journal 4: Graphing your Data to make a Map for the following:
Question 4. How many different graphs did you make? How many asteroids were on each graph? copy and paste the graphs to your journal.
Question 5. What shape do you see in the graphs? How many asteroids did you have to include before you could clearly see the shape?
Question 6. Remember that the graph you made is a map of the Solar System as seen from Earth. What do you think that shape you see means? Why does the map look like it does?
-
You have just made maps of the Solar System, as it is seen from Earth. You have seen an S-shaped curve in the maps. But what does that curve mean?
Remember that maps are models of the real world. Like any models, they are accurate in some ways and inaccurate in other ways. Thinking about how the maps are accurate or inaccurate can help you understand the world that the maps represent.
If you did the last activity about coordinate systems, think back to the first thing you did. Your teacher gave you a map of the Earth, and you rolled it up into a cylinder. Now, try the same thing with your map of the asteroids.
Explore 4. If you take a paper copy of the map you made in section e, you will be able to model the solar system. If you are able to print it on transparency paper, it will work even better..
First, use a marker to trace over the line through the celestial equator (This is where Dec = 0 degrees); you'll use this line in the next section. Then, cut off all the blank space around the edges, then wrap it into a cylinder and tape the two short sides together.
You are looking at a cylinder-shaped model of the Solar System as seen from Earth. However, because we look out at the Solar System from Earth, the Earth is on the inside of this model. That's why you made it out of transparency paper - so you could imagine yourself in the middle of the model, looking out.
Question 7. Imagine that you are on the Earth, in the middle of the cylinder, looking out. What would you see? Just formulate an answer in your mind.
So now you know what the Solar System looks like when seen from Earth. But how does the Earth fit into the Solar System? Scroll down to Lesson 3:Earth, Sun, and Seasons to find out. -
In your map of the Solar System from the last activity, you should see that the asteroids form a circle in the sky above the Earth. That circle should remind you of the models of the Solar System that you might remember from your textbook: the planets and asteroids go around the Sun in invisible paths called orbits.
But why are the asteroid orbits tilted?
Answer the following question in Journal 5: Earth, Sun, and Seasons
Explore 1. Explore the question of why the asteroid orbits are tilted. Look at the line you drew at Dec = 0 in the last activity. As you learned earlier, Dec = 0 corresponds to standing on the Earth's equator and looking directly up.
Use a protractor to measure the angle between the horizontal line of Dec = 0 and the asteroids. What is the angle?
Most asteroids go around the Sun in a plane called the ecliptic. If you look back at the map of the planets that you made in the last activity, you will see that the planets move in the ecliptic too. The angle you measured in Explore 1 is the angle between the plane of the Earth's equator and the ecliptic. This means that from the Earth's perspective, the ecliptic is tilted. But from the Sun's perspective, the ecliptic is straight and the Earth's equator is tilted.
Make a note in the journal about the ecliptic - define it, and explain what it has to do with your map.
-

Explore 2. Now, try taking the Sun's perspective. Imagine the Sun is at the center of your model, instead of the Earth. That is a more realistic perspective, because the asteroids really orbit the Sun rather than the Earth.
Of course, the Earth orbits the Sun also. On September 22nd of every year, the Earth is at about RA = 0, Dec = 0. Draw a small + (plus sign) mark at that point with permanent marker and label it "Sept. 22nd".
Now, rotate the model so that the ecliptic (the circle of asteroids and planets, which includes Earth) appears perfectly horizontal. Imagine that you are standing on the Sun (at the center of the cylinder), looking out at the Earth. You can see light rays going from the Sun out to the Earth. At what angle do these light rays hit the cylinder? (Assume that an angle of zero degrees means the rays hit straight up and down.)
Record your answers and notes in the previous journal, that is: Journal 5: Earth, Sun, and Seasons -
In the last Explore exercise, you saw that the Sun's rays hit the cylinder at an angle of zero degrees - straight up and down. This means that on September 22nd, the Sun's rays hit the equator at an angle of zero degrees, going straight up and down. But what happens on some other days of the year?
The table below shows the approximate position of the Earth, from the Sun's perspective, on several days.
Date RA Dec December 22nd 90 23 March 21st 180 0 June 21st 270 -23 Explore 3. Add plus signs onto the sphere for the points where the Earth is on March 21st, June 21st, and December 22nd? Label each of the plus signs with their dates. At what angle do the Sun's rays hit the Earth on these days?
The Earth is not a plus sign; it's a sphere. Even though the Earth is very small compared to the Sun, the fact that it is a sphere still has an important meaning for our lives on Earth.
A sphere like the Earth can be divided into two hemispheres. On the Earth, North America, Europe, and Asia lie in the Northern Hemisphere, while Australia and most of Africa and South America lie in the Southern Hemisphere.
Imagine that the plus signs you drew on the map are actually tiny spheres that represent the Earth. The Equator is the line in the middle. The North Pole is the line that points up, and the South Pole is the line that points down.
Question 1. In each of the four imaginary spheres, where is the Northern Hemisphere? Where is the Southern Hemisphere?
Question 2. Which hemisphere receives the most sunlight on June 21st? On December 22nd?
Again, record your answers and thoughts in the previous journal, that is, Journal 5: Earth, Sun, and SeasonsQuestion 3. How does the observation you made in Question 2 explain the seasons? How are seasons different between the Northern and Southern Hemispheres?
-
The diagram below is a computer-generated image that depicts the positions of the Sun and Earth during each season. You can see that the Northern and Southern hemispheres of the Earth receives different amounts of light from the Sun during different seasons.
In the previous journal, Journal 5: Earth, Sun, and Seasons, make a list 1 -4. Then starting with the right-most earth in the diagram above, type what season you think it is.
A diagram of the Sun and the Earth (not to scale) during each season